If you have ever been confused by the term “Business Intelligence”, then this article is for you. Let me explain:
Make Better Decisions, Faster
Companies need accurate data to make important business decisions for their organization, quickly. They need to use data to understand their customers, industry-wide trends, customer satisfaction and potential audiences for what they are selling. Additionally, they need to data to better understand their operations, financials, and resources. And make more informed business decisions, faster.
Every company needs accurate data to make decisions on its products, services, and customers. It needs to use data to understand customer trends, industry-wide trends, customer satisfaction and potential audiences for what it is selling.
Companies either have not enough information, or collect a lot of raw data. Often times, they will end up with so much raw data that it is hard to know exactly what they have. So, companies will spend lots of time and effort to create and optimize the right set of reports from their data, so they can optimize their decisions and business processes.
And over time, a company’s data needs will change. As trends shift and products mature, the data needs will also shift. The company must continuously put focus on the trends of their industry to ensure they are measuring the right things.
The reports themselves can also shift. Often times the information and data behind a report leaves with resources and employees, and the organization is left with bad data, that they are unable to update or fix.
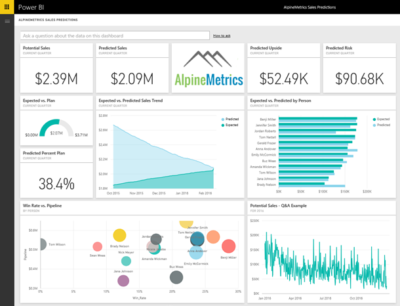
Microsoft created a product called Power BI that aims to simplify all of this. Using the tools provided by Power BI, reports and dashboards can be easily created (and re-created, pivoted, filtered and sorted!) Even better, different types of data and data sources can be used with Power BI. By importing a data set from Excel, SQL Server, or an online source, reports and dashboards can be created to represent and analyze data. Microsoft also provides many stock datasets contributed by users.
An Overview of Power BI
To create reports, a Windows desktop application called Power BI Desktop is used by a report developer to prepare the data and the report visualizations. PowerBI Desktop is a free tool, but there are some licensing requirements that may come into play once reports are being shared with users.
To consume reports, a user makes use of the cloud-based service Power BI, which has free and Pro versions. The Pro version allows a report consumer to save their settings and share the reports they have access to with others. This is also a mobile app that can be used to consume reports. Reports can also be published into Azure or on a company website using Power BI Embedded, but the consumer will have limited functionality to filter and export the data.
For large companies, they may also want to purchase a Power BI Premium subscription which provides for larger data limits, the ability to keep data behind a company firewall, and a Power BI Report Server which can be hosted by the company to provide a high-fidelity consumption experience.
Overall, Power BI is a great tool because of its minimal cost, rich personalized dashboards, secure report publishing, and ease of use for report creators and consumers. It also integrates easily with other Microsoft solutions, making customization and sharing easy across organizations and even customers. Business now has the power to create great looking, accurate reports quickly, with little to no intervention from technical departments.
At Artic Consulting, we are highly skilled with Power BI and how to easily add it to your overall business productivity solutions. Make better decisions faster for your organization. Contact us to start a conversation about how we can help your business.